Multiple Choice
Which of the following distributions best describe the density function for annual popcorn sales by a Cub Scout pack if the sales are approximately normally distributed and they almost always make between $300 and $500?
A) 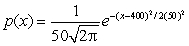
B) 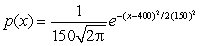
C) 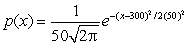
D) 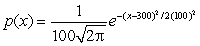
Correct Answer:

Verified
Correct Answer:
Verified
Q30: The graph of a probability density function
Q31: The density function for lunch time taken
Q32: The speed of cars on a freeway
Q33: A density function for the daily calorie
Q34: The race times for a group of
Q36: The probability of waiting no more than
Q37: The life expectancy of a bug can
Q38: Suppose <img src="https://d2lvgg3v3hfg70.cloudfront.net/TB8190/.jpg" alt="Suppose is
Q39: The speed of cars on a freeway
Q40: Let <img src="https://d2lvgg3v3hfg70.cloudfront.net/TB8190/.jpg" alt="Let be