Short Answer
Consider the following graph of a function. Assume the entire graph is shown. How many local minima does the function have? 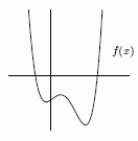
Correct Answer:

Verified
Correct Answer:
Verified
Related Questions
Q34: A disease is released into a town.
Q35: The dose response curve in the following
Q36: Which average cost function corresponds to the
Q37: The revenue for selling q items is
Q38: The quantity of a medication in the
Q40: The total cost, C, in dollars,when producing
Q41: The following three equations are graphed in
Q42: Raising the average price of an entree
Q43: Given <img src="https://d2lvgg3v3hfg70.cloudfront.net/TB8190/.jpg" alt="Given .
Q44: The average cost per item to produce