Short Answer
The dose response curve in the following figure is given by  , where R is percent of maximum response and x is the dose of the drug in mg. The inflection point is at (10,50) and
  . Would
  be greater or less than 7 for values of x less than 10?
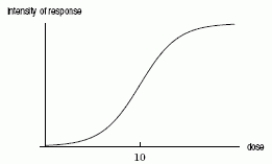
Correct Answer:

Verified
Correct Answer:
Verified
Q30: In Wilson corners, population 2000, a rumor
Q31: Given the following table of production quantities
Q32: For <img src="https://d2lvgg3v3hfg70.cloudfront.net/TB8190/.jpg" alt="For ,
Q33: A normal distribution in statistics is modeled
Q34: A disease is released into a town.
Q36: Which average cost function corresponds to the
Q37: The revenue for selling q items is
Q38: The quantity of a medication in the
Q39: Consider the following graph of a function.
Q40: The total cost, C, in dollars,when producing