Short Answer
The following table shows the number of oranges sold in one month,  , against the price per bag, p (in cents). Find an approximation for
  . Use the nearest right-hand value to make your estimate.
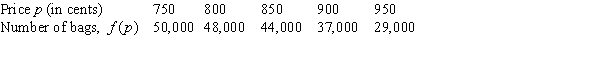
Correct Answer:

Verified
Correct Answer:
Verified
Q34: Recently Esther swam a lap in an
Q35: The graph of <img src="https://d2lvgg3v3hfg70.cloudfront.net/TB8190/.jpg" alt="The graph
Q36: Sketch a graph with the following conditions:
Q37: Consider the function f sketched in the
Q38: Given the following data about the function
Q40: Cost and revenue functions for a certain
Q41: A certain function f is decreasing and
Q42: A function f satisfies the following conditions:
Q43: Suppose <img src="https://d2lvgg3v3hfg70.cloudfront.net/TB8190/.jpg" alt="Suppose is
Q44: Assume that f and g are differentiable