Multiple Choice
The graph of  is shown in the following figure. Give an estimate for
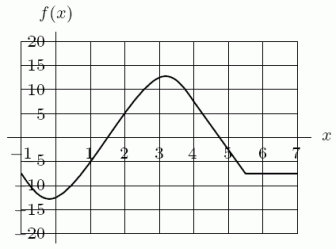
A) -10
B) 10
C) -20
D) 20
Correct Answer:

Verified
Correct Answer:
Verified
Related Questions
Q30: The cost of mining a ton of
Q31: The following table gives the cost and
Q32: Consider the two functions shown below. A.
Q33: A certain bacterial colony was observed for
Q34: Recently Esther swam a lap in an
Q36: Sketch a graph with the following conditions:
Q37: Consider the function f sketched in the
Q38: Given the following data about the function
Q39: The following table shows the number of
Q40: Cost and revenue functions for a certain