Short Answer
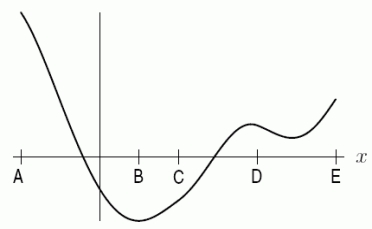
The graph of  is shown in the following figure. Arrange the following values in order from smallest to largest by placing a "1" by the smallest, a "2" by the next smallest, and so forth.
A.  B.
B.  C.
C.  D.
D.  E.
E. 
Correct Answer:

Verified
Part A: 1
...View Answer
Unlock this answer now
Get Access to more Verified Answers free of charge
Correct Answer:
Verified
...
View Answer
Unlock this answer now
Get Access to more Verified Answers free of charge
Q109: The function <img src="https://d2lvgg3v3hfg70.cloudfront.net/TB8190/.jpg" alt="The function
Q110: A company graphs <img src="https://d2lvgg3v3hfg70.cloudfront.net/TB8190/.jpg" alt="A company
Q111: The graph of <img src="https://d2lvgg3v3hfg70.cloudfront.net/TB8190/.jpg" alt="The graph
Q112: From the following graph, estimate <img src="https://d2lvgg3v3hfg70.cloudfront.net/TB8190/.jpg"
Q113: There is a population of <img src="https://d2lvgg3v3hfg70.cloudfront.net/TB8190/.jpg"
Q115: The graph of <img src="https://d2lvgg3v3hfg70.cloudfront.net/TB8190/.jpg" alt="The graph
Q116: Suppose a function is given by the
Q117: To produce 250 items the total cost
Q118: Using a calculator, estimate the derivative of
Q119: Consider the two functions shown below. A.