Short Answer
A company graphs  , the derivative of the number of pints of ice cream sold over the past ten years. Out of t=1,2,4,8, and 10, in what year was C ''(t) greatest?
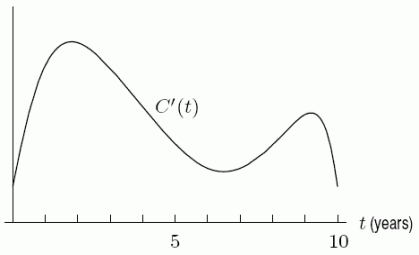
Correct Answer:

Verified
Correct Answer:
Verified
Q105: The graph of a cost function is
Q106: Using the graph of <img src="https://d2lvgg3v3hfg70.cloudfront.net/TB8190/.jpg" alt="Using
Q107: Suppose the graph of f is in
Q108: Consider the function f sketched in the
Q109: The function <img src="https://d2lvgg3v3hfg70.cloudfront.net/TB8190/.jpg" alt="The function
Q111: The graph of <img src="https://d2lvgg3v3hfg70.cloudfront.net/TB8190/.jpg" alt="The graph
Q112: From the following graph, estimate <img src="https://d2lvgg3v3hfg70.cloudfront.net/TB8190/.jpg"
Q113: There is a population of <img src="https://d2lvgg3v3hfg70.cloudfront.net/TB8190/.jpg"
Q114: The graph of <img src="https://d2lvgg3v3hfg70.cloudfront.net/TB8190/.jpg" alt="The graph
Q115: The graph of <img src="https://d2lvgg3v3hfg70.cloudfront.net/TB8190/.jpg" alt="The graph