Short Answer
This figure shows the rate of change of F. 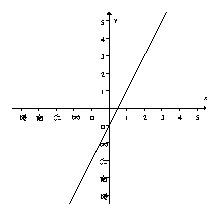 Given that F(0) = 2, sketch the graph of F.
Correct Answer:

Verified
Correct Answer:
Verified
Related Questions
Q70: Use integration by parts to find <img
Q71: Find the indefinite integral <img src="https://d2lvgg3v3hfg70.cloudfront.net/TB8190/.jpg" alt="Find
Q72: At what constant, continuous annual rate should
Q73: The supply and demand curves for a
Q74: Given the following graph of <img src="https://d2lvgg3v3hfg70.cloudfront.net/TB8190/.jpg"
Q76: Supply and demand data are given in
Q77: Supply and demand curves for an item
Q78: The supply and demand curves for a
Q79: Supply and demand curves for a product
Q80: The following figure shows the graph of