Short Answer
Supply and demand curves for a product are shown in the following figure. Estimate the equilibrium quantity. 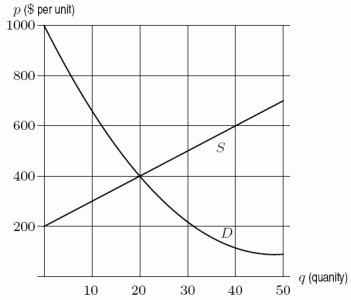
Correct Answer:

Verified
Correct Answer:
Verified
Q74: Given the following graph of <img src="https://d2lvgg3v3hfg70.cloudfront.net/TB8190/.jpg"
Q75: This figure shows the rate of change
Q76: Supply and demand data are given in
Q77: Supply and demand curves for an item
Q78: The supply and demand curves for a
Q80: The following figure shows the graph of
Q81: Evaluate <img src="https://d2lvgg3v3hfg70.cloudfront.net/TB8190/.jpg" alt="Evaluate ."
Q82: <img src="https://d2lvgg3v3hfg70.cloudfront.net/TB8190/.jpg" alt=" ." class="answers-bank-image d-inline"
Q83: The improper integral <img src="https://d2lvgg3v3hfg70.cloudfront.net/TB8190/.jpg" alt="The improper
Q84: Use integration by parts to find <img