Multiple Choice
Given the following graph of f, which is the best approximation for  ?
? 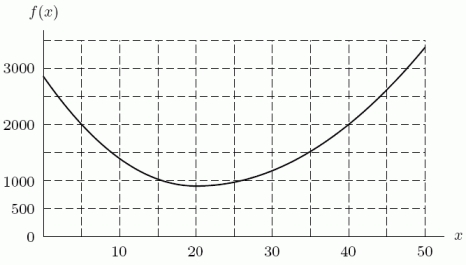
A) 51,000
B) 78,750
C) 84,500
D) 100,000
Correct Answer:

Verified
Correct Answer:
Verified
Related Questions
Q59: According to the European Journal of Clinical
Q60: If <img src="https://d2lvgg3v3hfg70.cloudfront.net/TB8190/.jpg" alt="If ,
Q61: A large scale commercial bakery makes cream
Q62: A new factory worker is put to
Q63: Below is a graph of the rate
Q65: If the upper estimate of the area
Q66: A large ice cube is melting at
Q67: A car is observed to have the
Q68: Data for a function G is given
Q69: An air conditioning unit is switched on