Multiple Choice
Below is a graph of the rate r in arrivals per minute at which students line up for breakfast. The first people arrive at 6:50 am and the line opens at 7:00 am. The line serves students at a constant rate of 20 students per minute. Estimate the time at which the line disappears. 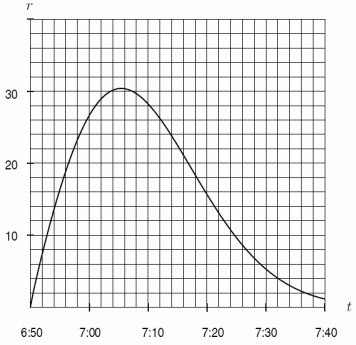
A) 7:10 am or earlier
B) 7:20 am
C) 7:30 am
D) 7:40 am or later
Correct Answer:

Verified
Correct Answer:
Verified
Q58: Your velocity, in meters per second, is
Q59: According to the European Journal of Clinical
Q60: If <img src="https://d2lvgg3v3hfg70.cloudfront.net/TB8190/.jpg" alt="If ,
Q61: A large scale commercial bakery makes cream
Q62: A new factory worker is put to
Q64: Given the following graph of f, which
Q65: If the upper estimate of the area
Q66: A large ice cube is melting at
Q67: A car is observed to have the
Q68: Data for a function G is given