Short Answer
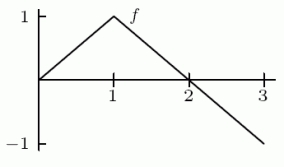
The graph of f is shown in the following figure. Find  if
if  and
and  .
. 
Correct Answer:

Verified
Correct Answer:
Verified
Related Questions
Q83: If the velocity function <img src="https://d2lvgg3v3hfg70.cloudfront.net/TB8190/.jpg" alt="If
Q84: The Ethnic food line at the Cougar
Q85: At time t, in seconds, the velocity
Q86: The balance in an investment account increases
Q87: Use the following table to estimate the
Q88: Estimate the area of the region under
Q89: Use the following table to estimate <img
Q90: If <img src="https://d2lvgg3v3hfg70.cloudfront.net/TB8190/.jpg" alt="If ,
Q91: A water line made of PVC decays
Q92: Suppose <img src="https://d2lvgg3v3hfg70.cloudfront.net/TB8190/.jpg" alt="Suppose and