Multiple Choice
The following graph shows the quantity of goods purchased by consumers at various prices. If the price is $15 per item, how many items do consumers purchase? 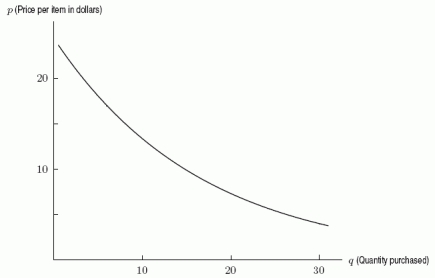
A) 5
B) 8
C) 12
D) 15
Correct Answer:

Verified
Correct Answer:
Verified
Related Questions
Q41: You have $500 invested in an account
Q42: Write a formula representing the function that
Q43: Using base e and transformations, find a
Q44: Given the equation <img src="https://d2lvgg3v3hfg70.cloudfront.net/TB8190/.jpg" alt="Given the
Q45: Use logarithms to solve the equation <img
Q47: A. Which two lines in the following
Q48: The graphs of <img src="https://d2lvgg3v3hfg70.cloudfront.net/TB8190/.jpg" alt="The graphs
Q49: Of the three functions below, one is
Q50: Sketch global pictures of the functions <img
Q51: A new music company wants to start