Multiple Choice
The graphs of  and
and  are given in the following figure. Estimate
  .
. 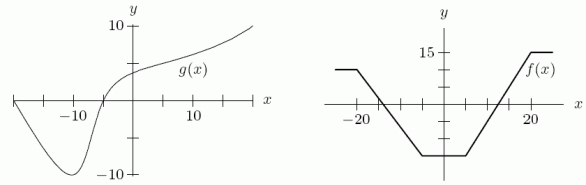
A) -7
B) -15
C) 
D) 15
Correct Answer:

Verified
Correct Answer:
Verified
Related Questions
Q43: Using base e and transformations, find a
Q44: Given the equation <img src="https://d2lvgg3v3hfg70.cloudfront.net/TB8190/.jpg" alt="Given the
Q45: Use logarithms to solve the equation <img
Q46: The following graph shows the quantity of
Q47: A. Which two lines in the following
Q49: Of the three functions below, one is
Q50: Sketch global pictures of the functions <img
Q51: A new music company wants to start
Q52: The elimination half-life of aspirin in plasma
Q53: Suppose $1200 is invested at 10% annual