Multiple Choice
The following figure gives both supply and demand curves for a certain product. If the price is $50 per item, how many items will the consumers buy? 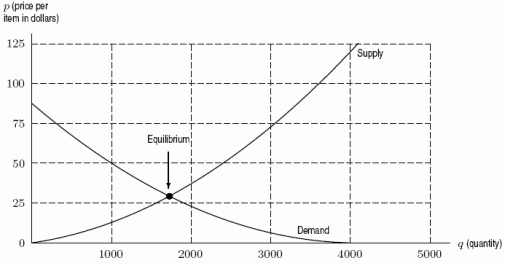
A) 1000
B) 2400
C) 1700
D) 4000
Correct Answer:

Verified
Correct Answer:
Verified
Related Questions
Q61: The bill for electricity is $200 when
Q62: One of the following tables of data
Q63: The number of species, S, on an
Q64: A population is growing according to the
Q65: Suppose that <img src="https://d2lvgg3v3hfg70.cloudfront.net/TB8190/.jpg" alt="Suppose that
Q67: What is the equation for the graph
Q68: A bar of soap starts out at
Q69: Joe invested $10,000 in the stock market,
Q70: The graph of <img src="https://d2lvgg3v3hfg70.cloudfront.net/TB8190/.jpg" alt="The graph
Q71: The following table gives values of three