Short Answer
The graph of  is shown in the following figure. Is the graph concave down or concave up at x = 4?
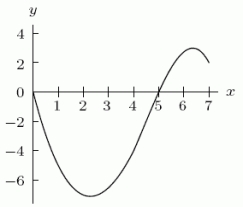
Correct Answer:

Verified
Correct Answer:
Verified
Related Questions
Q65: Suppose that <img src="https://d2lvgg3v3hfg70.cloudfront.net/TB8190/.jpg" alt="Suppose that
Q66: The following figure gives both supply and
Q67: What is the equation for the graph
Q68: A bar of soap starts out at
Q69: Joe invested $10,000 in the stock market,
Q71: The following table gives values of three
Q72: Give a possible formula for the function
Q73: Let <img src="https://d2lvgg3v3hfg70.cloudfront.net/TB8190/.jpg" alt="Let and
Q74: Solve <img src="https://d2lvgg3v3hfg70.cloudfront.net/TB8190/.jpg" alt="Solve for
Q75: The number of reported offenses of violent