Multiple Choice
Work: A graph of the force on an object as a function of its position is shown in the figure. Determine the amount of work done by this force on the object during a displacement from x = -2.00 m to x = 2.00 m. (Assume an accuracy of 3 significant figures for the numbers on the graph.) 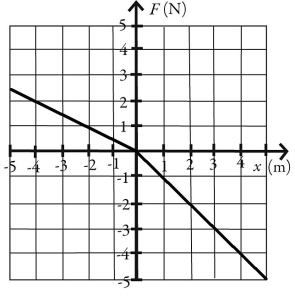
A) -12.0 J
B) -3.00 J
C) -1.00 J
D) 12.0 J
E) 3.00 J
Correct Answer:

Verified
Correct Answer:
Verified
Q24: Work-energy theorem: A 1000 kg car experiences
Q25: Energy conservation with conservative forces: An object
Q26: Work-energy theorem: A constant horizontal pull acts
Q27: Work: Three forces: F<sub>1</sub> = 20.0 N,
Q28: Work-energy theorem: If a force always acts
Q30: Hooke's law: Which of the graphs in
Q31: Work: A crane lifts a 425 kg
Q32: Energy conservation with conservative forces: In the
Q33: Work done by variable forces: It requires
Q34: Hooke's law: Block A (0.40 kg) and