Short Answer
TABLE 17-9
The manufacturer of canned food constructed control charts and analyzed several quality characteristics.One characteristic of interest is the weight of the filled cans.The lower specification limit for weight is 2.95 pounds.The table below provides the range and mean of the weights of five cans tested every fifteen minutes during a day's production.
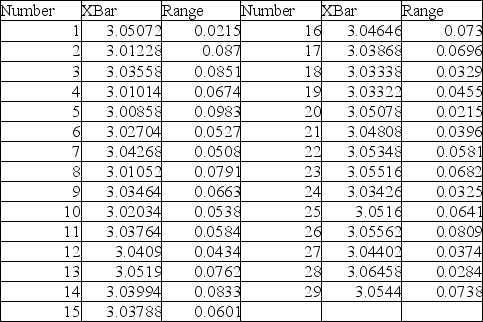
-Referring to Table 17-9,an  chart is to be used for the weight.One way to obtain the control limits is to take the grand mean and add and subtract the product of A₂ times the mean of the sample ranges.For this data set,the value of A₂ is ________.
Correct Answer:

Verified
Correct Answer:
Verified
Q12: TABLE 17-7<br>A supplier of silicone sheets for
Q15: TABLE 17-2<br>A political pollster randomly selects a
Q23: TABLE 17-9<br>The manufacturer of canned food constructed
Q55: The R chart is a control chart
Q64: TABLE 17-9<br>The manufacturer of canned food constructed
Q82: Which of the following is not one
Q98: TABLE 17-4<br>A factory supervisor is concerned that
Q108: TABLE 17-4<br>A factory supervisor is concerned that
Q135: The purpose of a control chart is
Q139: Variation due to the inherent variability in