Multiple Choice
This OC curve represents a sampling plan developed for a lot size of 1,000, a sample size of 15, and an acceptance number of 2. The probability of acceptance for each of the first six points appears next to the plotted point. What is the average outgoing quality for an incoming fraction defective of 0.25? 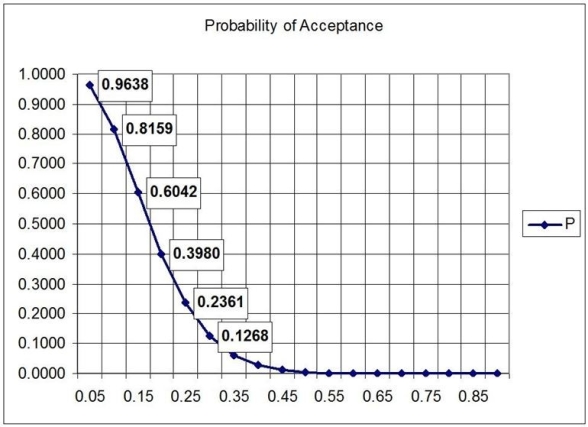
A) less than 0.045
B) greater than or equal to 0.045 but less than 0.055
C) greater than or equal to 0.055 but less than 0.065
D) greater than or equal to 0.065
Correct Answer:

Verified
Correct Answer:
Verified
Q1: Use Table G.1 for the following question.
Q2: A sequential sampling plan generally lowers the
Q3: Which one of the following alternatives will
Q5: Champion Cooling Company has developed a sampling
Q6: A company is developing an acceptance sampling
Q7: A lot of 2,000 items has just
Q8: Discuss producer's risk and consumer's risk.
Q9: Which of the following is an example
Q10: For a given AQL and LTPD, which
Q11: Which of the following statements is True?<br>A)