Essay
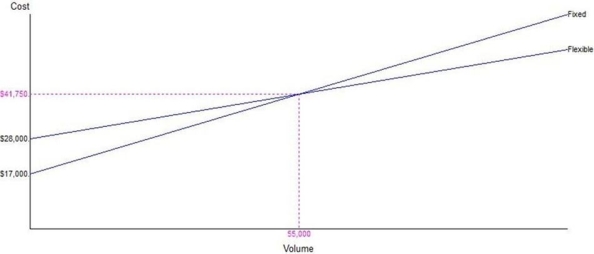
The break-even graph shown below represents the cost structure associated with a flexible production process and one that is fixed (less flexible). Using the information displayed in the graph, determine the cost structures associated with the two alternative production methods.
Correct Answer:

Verified
The Fixed alternative has a fixed cost o...View Answer
Unlock this answer now
Get Access to more Verified Answers free of charge
Correct Answer:
Verified
View Answer
Unlock this answer now
Get Access to more Verified Answers free of charge
Q229: _ is the documentation and detailed understanding
Q230: Front offices typically emphasize:<br>A) low cost operations
Q231: The first unit of production takes 20
Q232: Job processes generally have higher volumes than
Q233: Describe and highlight differences among the three
Q234: Provide examples of three different processes that
Q235: An industrial engineer observes a brand new
Q236: High customer involvement increases service provider productivity
Q237: Describe the differences among make-to-order, assemble-to-order, and
Q238: Scenario 2.3<br>A job consists of three elements.