Multiple Choice
A restaurant manager tracks complaints from the diner satisfaction cards that are turned in at each table. The data collected from the past week's diners have been plotted and appear in the following graph. The number of complaints for each category is with each bar. 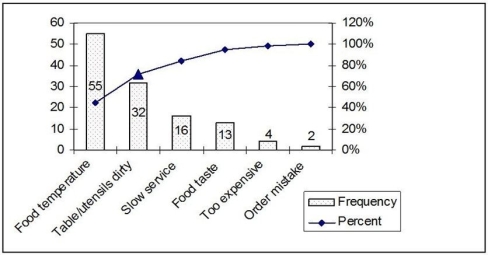
How was the value for the point represented by the triangle calculated?
A)
B)
C)
D)
Correct Answer:

Verified
Correct Answer:
Verified
Q3: Flowcharts, service blueprints, and process charts are
Q4: A professor can grade a quiz in
Q5: Performance measures such as average response times,
Q6: The "Define" step of the Six Sigma
Q7: Scenario 2.1<br>Garman observes a worker assembling peanut
Q9: Scenario 2.6<br>You currently purchase a part used
Q10: Widespread participation in process analysis is essential
Q11: A(n) _ shows processing steps grouped according
Q12: A systematic approach to process analysis includes
Q13: The principle of postponement is modeled by