Multiple Choice
Table 5.11
Factors for Calculating Three-Sigma Limits for the
Chart and R-Chart
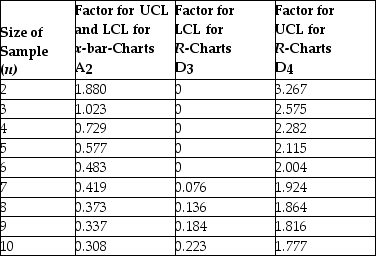
Source: 1950 ASTM Manual on Quality Control of Materials, copyright American Society for Testing Materials. Reprinted with permission.
-Thermostats are subjected to rigorous testing before they are shipped to air conditioning technicians around the world. Results from the last five samples are shown in the table. Calculate control limits for a chart that will monitor performance to target. The correct control limits as (LCL,UCL) are: 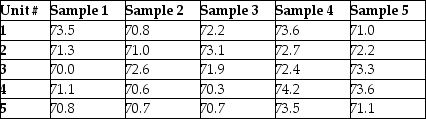
A) (70.46, 73.39) .
B) (68.94,74.89) .
C) (69.71,74.14) .
D) (69.80,74.05) .
Correct Answer:

Verified
Correct Answer:
Verified
Q103: One chart commonly used for quality
Q104: Small groups of employees and supervisors that
Q105: Quality measured with reference to price is
Q106: Samples of size 4 were taken from
Q107: Applying Six Sigma to service processes is
Q109: A process with a target of 25
Q110: Using a value of 0.729 for the
Q111: The defect rate for a product has
Q112: Table 5.11<br>Factors for Calculating Three-Sigma Limits
Q113: Because Six Sigma involves the elimination of