Essay
Using a value of 0.729 for the A₂ lookup from Table 5.1 yields:
UCL = 24.6 + 0.729*5.73 = 28.8
LCL = 24.6 - .729*5.73 = 20.4
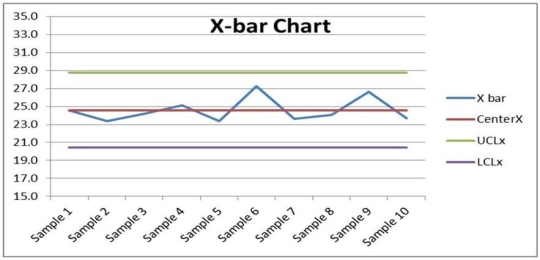
The chart is in control.
-A professor records the number of students who complain each week throughout the semester. If the class size is forty students, what are 3-sigma control limits for this class? Construct a control chart and interpret the data.

Correct Answer:

Verified
Correct Answer:
Verified
Q105: Quality measured with reference to price is
Q106: Samples of size 4 were taken from
Q107: Applying Six Sigma to service processes is
Q108: Table 5.11<br>Factors for Calculating Three-Sigma Limits
Q109: A process with a target of 25
Q111: The defect rate for a product has
Q112: Table 5.11<br>Factors for Calculating Three-Sigma Limits
Q113: Because Six Sigma involves the elimination of
Q114: Quality at the source refers to the
Q115: Table 5.11<br>Factors for Calculating Three-Sigma Limits