Multiple Choice
Table 5.11
Factors for Calculating Three-Sigma Limits for the
Chart and R-Chart
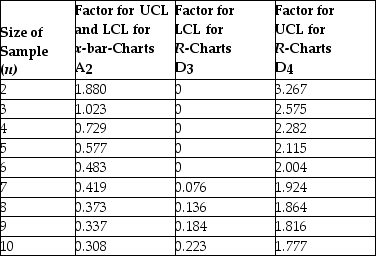
Source: 1950 ASTM Manual on Quality Control of Materials, copyright American Society for Testing Materials. Reprinted with permission.
-Construct 3-sigma X-bar and R-charts using the data in the table. What conclusions can you draw about the state of control for this process? 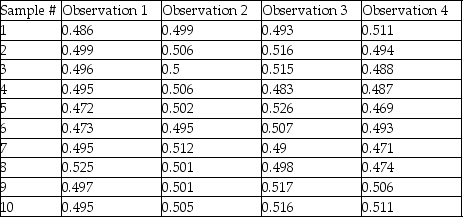
A) X-bar chart is out of control but the R-chart is in control
B) the X-bar chart is out of control and the R-chart is also out of control
C) the X-bar chart and the R-chart are both in control
D) the X-bar chart is in control but the R-chart is out of control
Correct Answer:

Verified
Correct Answer:
Verified
Q110: Using a value of 0.729 for the
Q111: The defect rate for a product has
Q112: Table 5.11<br>Factors for Calculating Three-Sigma Limits
Q113: Because Six Sigma involves the elimination of
Q114: Quality at the source refers to the
Q116: With respect to the systems approach of
Q117: A bank randomly looks at loan applications
Q118: What is the long-term impact of unethical
Q119: The upper and lower control limits for
Q120: Process centering is shown by an