Multiple Choice
Four samples of 100 each were taken from an assembly line, with the following results: 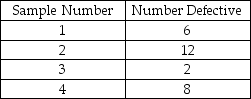
Using the historical average as the central line of the chart, which one of the following is the limit for an attributes control chart with z = 2?
A) UCL > 0.1 and LCL > 0.03
B) UCL > 0.1 and LCL < 0.03
C) UCL < 0.1 and LCL > 0.03
D) UCL < 0.1 and LCL < 0.03
Correct Answer:

Verified
Correct Answer:
Verified
Q40: Which of these elements is not part
Q41: Which of these ISO standards has the
Q42: The underlying statistical distribution for the p-chart
Q43: _ refers to how well the product
Q44: Process capability can be addressed when:<br>A) assignable
Q46: What are the steps in the Six
Q47: Continuous improvement is one of the four
Q48: Regarding control charts, changing from two-sigma limits
Q49: The TQM pillar of _ involves the
Q50: Five samples of size 4 were