Essay
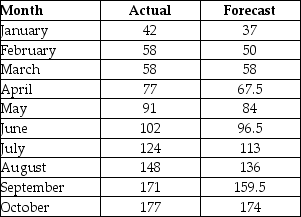
Ten months of data and the forecasts for those same periods are in the table below. Use mean bias, MAD, and MAPE to analyze the accuracy of the forecasts.
Correct Answer:

Verified

Bias = 7...View Answer
Unlock this answer now
Get Access to more Verified Answers free of charge
Correct Answer:
Verified
Bias = 7...
View Answer
Unlock this answer now
Get Access to more Verified Answers free of charge
Related Questions
Q7: A tracking signal greater than zero and
Q8: The judgment methods of forecasting are to
Q9: When the underlying mean of a time
Q10: A(n) _ forecast is a time-series method
Q11: Graph 8.1<br>Data plotted in the graph appear
Q13: An exponential smoothing model with an alpha
Q14: Describe some of the managerial considerations required
Q15: A simple moving average of one period
Q16: _ are produced by averaging independent forecasts
Q17: There are historically three 32-month periods of