Multiple Choice
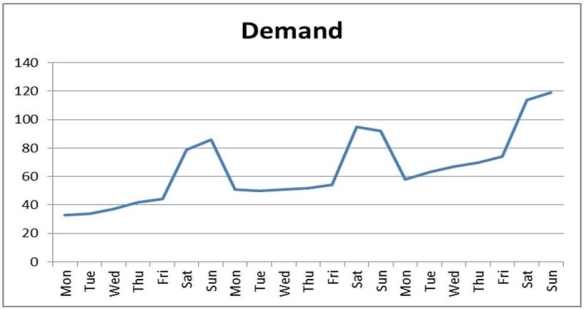
Graph 8.1
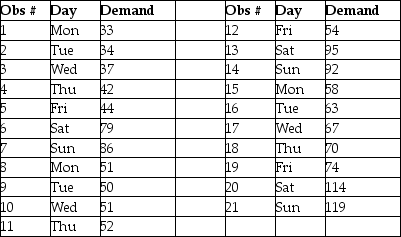
Data plotted in the graph appear in the table below.


-If forecast errors are normally distributed with a mean of 0, the relationship between σ and MAD is:
A) 1.25MAD ≈ σ
B) MAD ≈ 1.25σ
C) MAD ≈ 0.5σ
D) 0.8MAD ≈ σ
Correct Answer:

Verified
Correct Answer:
Verified
Related Questions
Q6: Graph 8.1<br>Data plotted in the graph appear
Q7: A tracking signal greater than zero and
Q8: The judgment methods of forecasting are to
Q9: When the underlying mean of a time
Q10: A(n) _ forecast is a time-series method
Q12: Ten months of data and the forecasts
Q13: An exponential smoothing model with an alpha
Q14: Describe some of the managerial considerations required
Q15: A simple moving average of one period
Q16: _ are produced by averaging independent forecasts