Essay
A councilman was interested in determining whether people between the ages of 18 and 30 years of age will react to a piece of legislation differently than people over 30 years of age. The legislator polled a sample of 150 people from his district. The resulting data is shown in the table below: 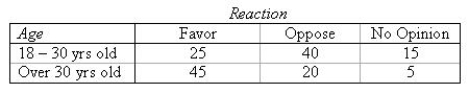 Construct a side-by-side bar chart.
Construct a pie chart for the 18 - 30 age group.
Construct a pie chart for the Over 30 age group.
Which of the two types of presentations in parts (a) and (b) is more easily understood?
______________
Correct Answer:

Verified
Correct Answer:
Verified
Q5: A perfect straight line sloping upward would
Q6: Which of the following are measures of
Q7: A manager of a supermarket wishes to
Q8: If the correlation coefficient <img src="https://d2lvgg3v3hfg70.cloudfront.net/TB8220/.jpg" alt="If
Q9: A perfect straight line sloping downward would
Q11: If all the points in a scatterplot
Q12: A soft drink distributor was interested in
Q14: Given that <img src="https://d2lvgg3v3hfg70.cloudfront.net/TB8220/.jpg" alt="Given that
Q15: A scatterplot is not particularly useful in
Q71: A perfect correlation between two variables will