Short Answer
A soft drink distributor was interested in examining the relationship between the number of ads (x) for his product during prime time on a local television station and the number of sales per week (y) in thousands of cases. He compiled the figures for 20 weeks and computed the following summary information: 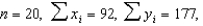
 and
and  Find the correlation coefficient for the number of ads during prime time and weekly sales.
______________
Find the best-fitting line relating the number of ads during prime time and weekly sales.
y = ______________
If the soft drink distributor ran 21 TV ads per week for his product, what would you predict his sales to be?
______________ thousand cases
Correct Answer:

Verified
0.908; 0.1...View Answer
Unlock this answer now
Get Access to more Verified Answers free of charge
Correct Answer:
Verified
View Answer
Unlock this answer now
Get Access to more Verified Answers free of charge
Q7: A manager of a supermarket wishes to
Q8: If the correlation coefficient <img src="https://d2lvgg3v3hfg70.cloudfront.net/TB8220/.jpg" alt="If
Q9: A perfect straight line sloping downward would
Q10: A councilman was interested in determining whether
Q11: If all the points in a scatterplot
Q14: Given that <img src="https://d2lvgg3v3hfg70.cloudfront.net/TB8220/.jpg" alt="Given that
Q15: A scatterplot is not particularly useful in
Q16: A perfect straight line sloping downward would
Q17: Which value of the correlation coefficient r
Q71: A perfect correlation between two variables will