Essay
Male and female respondents to a questionnaire about gender differences are categorized into three groups according to their answers as shown below: 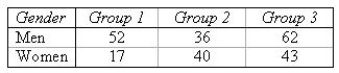 Create a side-by-side bar chart to describe these data.
Create two pie charts (one for men and one for women) to describe these data.
Men:
Women:
Which of the charts created above best depicts the difference or similarity of the responses of men and women.
______________
Correct Answer:

Verified
Correct Answer:
Verified
Q1: When the price of gasoline gets high,
Q2: If the correlation coefficient <img src="https://d2lvgg3v3hfg70.cloudfront.net/TB8220/.jpg" alt="If
Q4: The standard deviation is a measure of
Q5: A perfect straight line sloping upward would
Q6: Which of the following are measures of
Q7: A manager of a supermarket wishes to
Q8: If the correlation coefficient <img src="https://d2lvgg3v3hfg70.cloudfront.net/TB8220/.jpg" alt="If
Q9: A perfect straight line sloping downward would
Q10: A councilman was interested in determining whether
Q11: If all the points in a scatterplot