Essay
A quality analyst wants to construct a sample mean chart for controlling a packaging process. He knows from past experience that when the process is operating as intended, packaging weight is normally distributed with a mean of twenty ounces, and a process standard deviation of two ounces. Each day last week, he randomly selected four packages and weighed each. The data from that activity appear below.
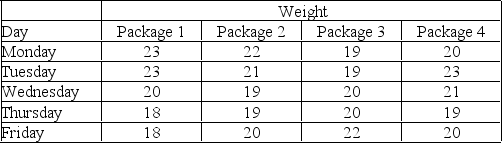 (a) If he sets an upper control limit of 21 and a lower control limit of 19 around the target value of twenty ounces, the control chart is based on what value of z?
(b) With the UCL and LCL of part a, what do you conclude about this process-is it in control?
Correct Answer:

Verified
(a) These control limits are one standar...View Answer
Unlock this answer now
Get Access to more Verified Answers free of charge
Correct Answer:
Verified
View Answer
Unlock this answer now
Get Access to more Verified Answers free of charge
Q45: What are the three possible results (or
Q46: Flowcharts use distance, but not time, to
Q47: The c-chart signals whether there has been
Q48: An x-bar chart is used when we
Q49: Fast-food restaurants usually adopt a product-focused strategy
Q51: A job shop is an example of
Q52: A part that connects two levels should
Q53: The x-bar chart indicates that a gain
Q54: Mean charts and range charts complement one
Q55: The Central Limit Theorem states that when