Essay
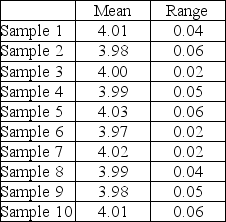
A part that connects two levels should have a distance between the two holes of 4". It has been determined that x-bar and R-charts should be set up to determine if the process is in statistical control. The following ten samples of size four were collected. Calculate the control limits, plot the control charts, and determine if the process is in control.
Correct Answer:

Verified
 The process is out...
View Answer
Unlock this answer now
Get Access to more Verified Answers free of charge
Correct Answer:
Verified
View Answer
Unlock this answer now
Get Access to more Verified Answers free of charge
Q47: The c-chart signals whether there has been
Q48: An x-bar chart is used when we
Q49: Fast-food restaurants usually adopt a product-focused strategy
Q50: A quality analyst wants to construct a
Q51: A job shop is an example of
Q53: The x-bar chart indicates that a gain
Q54: Mean charts and range charts complement one
Q55: The Central Limit Theorem states that when
Q56: _ represent an organization's attempt to gain
Q57: The causes of variation in statistical process