Multiple Choice
This bar graph shows the percentage of college freshmen at ABC College needing to take a developmental math class as of the fall of the given year: 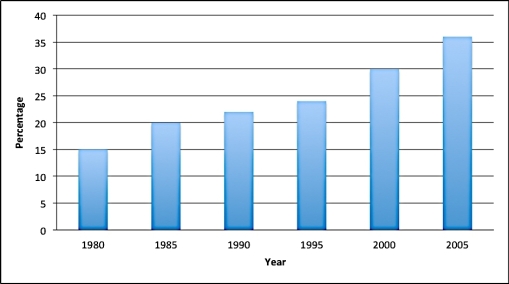 Find the average yearly growth rate from 1995 to 2000.
A) 6.0%
B) 1.6%
C) 1.2%
D) 1.5%
Correct Answer:

Verified
Correct Answer:
Verified
Related Questions
Q12: The following table shows average prices per
Q13: The population in a certain city has
Q14: The following table from the World Health
Q15: The following table shows the number of
Q16: Percentage _ in a function is the
Q18: The following table shows the average starting
Q19: The amount of tax you owe is
Q20: A _ is a graph consisting of
Q21: It is not important to know whether
Q22: In 1949, the inflation rate in the