Multiple Choice
The following bar graph shows the annual attendance at a state fair: 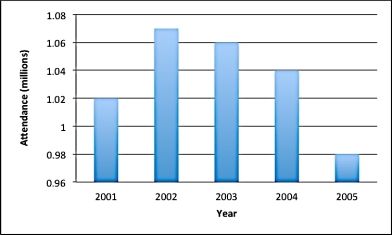 The chart seems to show a sharp increase in attendance from 2001 to 2002. Calculate the percentage change from 2001 to 2002.
A) 25%
B) 15%
C) 10%
D) 5%
Correct Answer:

Verified
Correct Answer:
Verified
Related Questions
Q4: A smoothed line graph is made from
Q5: According to a report, the percentage of
Q6: _ is the process of estimating unknown
Q7: The following table shows the balance of
Q8: The following table shows the average price
Q10: When we adjust a graph for inflation,
Q11: The following table from the World Health
Q12: The following table shows average prices per
Q13: The population in a certain city has
Q14: The following table from the World Health