Multiple Choice
The following graphic of residential housing data (selling price and size in square feet) is a ___. 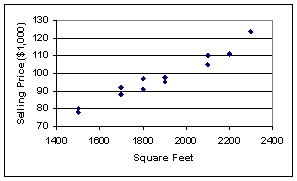
A) scatter plot
B) Pareto chart
C) pie chart
D) cumulative histogram
E) cumulative frequency distribution
Correct Answer:

Verified
Correct Answer:
Verified
Related Questions
Q19: A histogram can be described as a
Q55: The staff of Mr.Wayne Wertz, VP of
Q57: Consider the following frequency distribution:
Q58: The staff of Ms.Tamara Hill, VP of
Q63: An instructor has decided to graphically represent
Q64: The 2019 and 2020 market share data
Q68: A cumulative frequency distribution provides a running
Q72: A scatter plot is useful for examining
Q85: To show hourly sales throughout a day,
Q108: A graphical representation of a frequency distribution