Multiple Choice
The 2019 and 2020 market share data of the three competitors (A, B, and C) in an oligopolistic industry are presented in the following pie charts.Total sales for this industry were $1.5 billion in 2019 and $1.8 billion in 2020.Company C's sales in 2020 were ___. 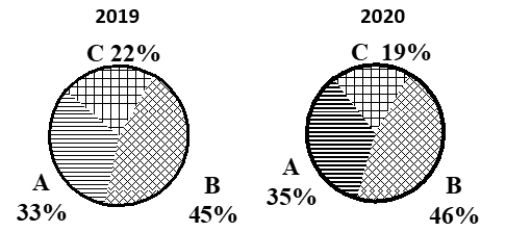
A) $342 million
B) $630 million
C) $675 million
D) $828 million
E) $928 million
Correct Answer:

Verified
Correct Answer:
Verified
Q40: A Pareto chart and a pie chart
Q56: If the individual class frequency is divided
Q59: The following graphic of residential housing data
Q63: An instructor has decided to graphically represent
Q65: Consider the following stem and leaf plot:
Q68: A cumulative frequency distribution provides a running
Q68: A shirt production company has tracked their
Q72: A scatter plot is useful for examining
Q85: To show hourly sales throughout a day,
Q94: Pinky Bauer, Chief Financial Officer of