Multiple Choice
A shirt production company has tracked their production since the company started in 1999.The graph of their annual production is shown. 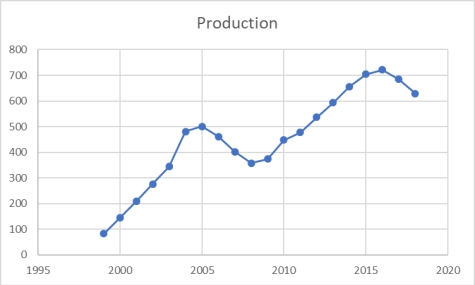 After 2005, in what year did production recover and surpass the production level of 2005?
A) 2006
B) 2009
C) 2010
D) 2012
E) 2013
Correct Answer:

Verified
Correct Answer:
Verified
Q33: Visualization of time-series data is considered descriptive
Q40: A Pareto chart and a pie chart
Q56: If the individual class frequency is divided
Q63: An instructor has decided to graphically represent
Q64: The 2019 and 2020 market share data
Q65: Consider the following stem and leaf plot:
Q71: The staff of Mr.Wayne Wertz, VP of
Q72: Consider the following stem and leaf plot:
Q94: Pinky Bauer, Chief Financial Officer of
Q97: The point of "cleaning" time-series data is