Multiple Choice
Sales are tracked during the past year in the graph below. 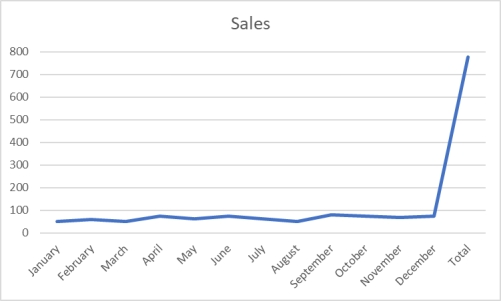 What would be the most effective strategy to allow management to more clearly discern monthly trends in sales?
A) Remove the total value from being included in the graph.
B) Have the axis on the left show more detailed grid lines between 0 and 100
C) Show the trend line in a more vivid color.
D) Add labels to each of the graphed data points.
E) Add minor grid lines throughout the graph making values more clear.
Correct Answer:

Verified
Correct Answer:
Verified
Q3: The cumulative frequency for a class is
Q9: The difference between the highest number and
Q14: The number of phone calls arriving
Q25: A retail shoe company would like to
Q27: According to the following graphic, "Bent Pins"
Q30: The following class intervals for a frequency
Q31: Abel Alonzo, Director of Human Resources, is
Q31: An instructor has decided to graphically represent
Q35: The following graphic of residential housing data
Q96: Consider the relative frequency distribution given