Multiple Choice
The following graphic of residential housing data (selling price and size in square feet) indicates ___. 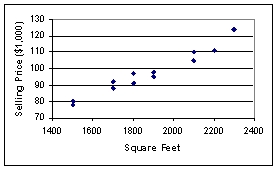
A) an inverse relation between the two variables
B) no relation between the two variables
C) a direct relation between the two variables
D) a negative exponential relation between the two variables
E) a sinusoidal relationship between the two variables
Correct Answer:

Verified
Correct Answer:
Verified
Q3: The cumulative frequency for a class is
Q14: The number of phone calls arriving
Q25: A retail shoe company would like to
Q30: The following class intervals for a frequency
Q31: Abel Alonzo, Director of Human Resources, is
Q32: Sales are tracked during the past year
Q38: The following graphic of PCB Failures is
Q39: The following graphic of cigarettes smoked (sold)per
Q54: Time-series data should be shown from oldest
Q96: Consider the relative frequency distribution given