Multiple Choice
Figure: The Demand Curve 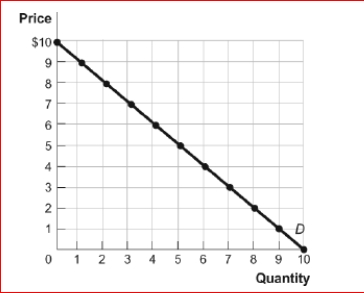
 (Figure: The Demand Curve) Look again at the figure The Demand Curve.Using the midpoint method, the price elasticity of demand between $1 and $2 is approximately:
A) 0.16.
B) 0.56.
C) 1.8.
D) 5.67.
Correct Answer:

Verified
Correct Answer:
Verified
Q39: Suppose the cross-price elasticity of demand for
Q40: The price elasticity of demand for fresh
Q40: If you know the cross-price elasticity between
Q41: The price of a gallon of gasoline
Q42: Figure: The Demand for Notebook Computers<br> <img
Q44: Nico rents 10% more DVDs when his
Q46: If the absolute value of the price
Q49: Figure: The Demand Curve <img src="https://d2lvgg3v3hfg70.cloudfront.net/TB1063/.jpg" alt="Figure:
Q63: The pair of items that is most
Q84: On a linear demand curve:<br>A)demand is elastic