Multiple Choice
Figure: The Demand Curve 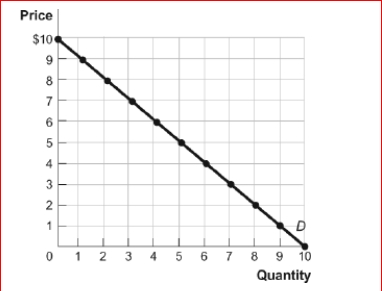
 (Figure: The Demand Curve) Look again at the figure The Demand Curve.Using the midpoint method, the price elasticity of demand between $6 and $8 is approximately:
A) 0.23.
B) 0.45.
C) 2.33.
D) 4.5.
Correct Answer:

Verified
Correct Answer:
Verified
Related Questions
Q35: Suppose the cross-price elasticity of demand for
Q39: Suppose the cross-price elasticity of demand for
Q40: If you know the cross-price elasticity between
Q44: Nico rents 10% more DVDs when his
Q45: Figure: The Demand Curve <img src="https://d2lvgg3v3hfg70.cloudfront.net/TB1063/.jpg" alt="Figure:
Q46: If the absolute value of the price
Q52: Assume the supply curve shifts to the
Q53: The university hopes to raise more revenue
Q54: The price elasticity of demand can be
Q63: The pair of items that is most