Multiple Choice
Use the following to answer questions : 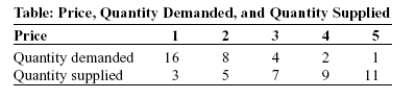
-(Table: Price, Quantity Demanded, and Quantity Supplied) Look at the table Price, Quantity Demanded, and Quantity Supplied. The slope of the line representing the relation between price on the vertical axis and quantity supplied on the horizontal axis is:
A) equal to 1/2.
B) equal to 1.
C) equal to 2.
D) different at different points on the line.
Correct Answer:

Verified
Correct Answer:
Verified
Q17: Use the following to answer question :<br>Figure:
Q18: The scaling of the axes of a
Q19: An economist wishes to build a model
Q20: Use the following to answer questions :<br>Figure:
Q22: The relation between two variables that move
Q23: Use the following to answer questions :<br>Figure:
Q24: Use the following to answer questions :<br>Table:
Q25: Use the following to answer questions :
Q26: Use the following to answer question :<br>Figure:
Q27: Use the following to answer questions: <img