Multiple Choice
Use the following to answer questions : 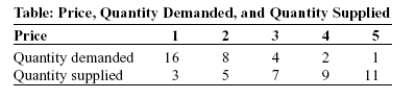
-(Table: Price, Quantity Demanded, and Quantity Supplied) Look at the table Price, Quantity Demanded, and Quantity Supplied. The data in the figure suggest a nonlinear relation between:
A) price and quantity demanded.
B) price and quantity supplied.
C) quantity demanded and quantity supplied.
D) The table does not show a nonlinear relation.
Correct Answer:

Verified
Correct Answer:
Verified
Q20: Use the following to answer questions :<br>Figure:
Q22: Use the following to answer questions :
Q22: The relation between two variables that move
Q23: Use the following to answer questions :<br>Figure:
Q24: Use the following to answer questions :<br>Table:
Q24: A _ graph shows how the value
Q26: Use the following to answer question :<br>Figure:
Q27: Use the following to answer questions: <img
Q28: Use the following to answer questions :<br>Figure:
Q30: Use the following to answer questions :<br>Figure: