Multiple Choice
Figure: Harold's Indifference Curves The figure shows three of Harold's indifference curves for bread and cheese. 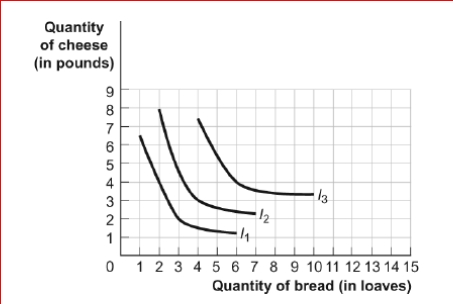
 (Figure: Harold's Indifference Curves) Look at the figure Harold's Indifference Curves.If the price of bread is $2 per loaf, the price of cheese is $4, and Harold has $28 to spend on bread and cheese, what is Harold's optimal consumption bundle of bread and cheese?
A) 6 loaves of bread and 4 pounds of cheese
B) 4 loaves of bread and 3 pounds of cheese
C) 3 loaves of bread and 2 pounds of cheese
D) 2 loaves of bread and 8 pounds of cheese
Correct Answer:

Verified
Correct Answer:
Verified
Q89: According to the relative price rule, the
Q90: Figure: Budget Lines for Oranges and Apples<br>
Q91: (Table: Bundles of X and Y) Look
Q92: Figure: Consumer Equilibrium IV <img src="https://d2lvgg3v3hfg70.cloudfront.net/TB1063/.jpg" alt="Figure:
Q93: Figure: Income and Substitution Effects<br>(Figure: Income and
Q95: (Table: Utility from Oranges and Starfruit) Oranges
Q96: The price of popcorn is $0.50 per
Q97: Figure: The Optimal Consumption Bundle<br>(Figure: The Optimal
Q98: Diminishing marginal utility occurs with increasing total
Q99: Scenario: Tom's Budget Constraint<br>Tom is trying to