Essay
Figure: Budget Lines for Oranges and Apples
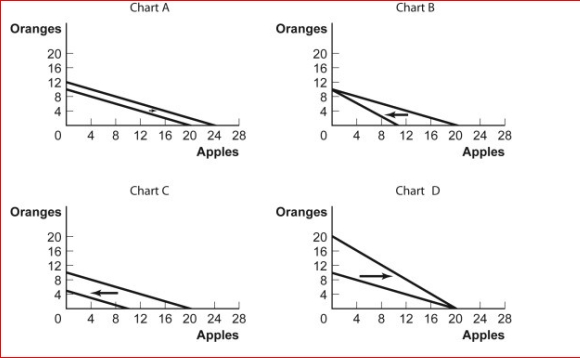
 (Figure: Budget Lines for Oranges and Apples) Look at the figures Budget Lines for Oranges and Apples.For some time, Antonio has $5 per month to spend on oranges and apples.The price of an orange is $0.50 and the price of an apple is $0.25.Which of the charts shows what will happen to his budget line if the price of an apple rises to $0.50?
A.Chart A
B.Chart B
C.Chart C
D.Chart D
Correct Answer:

Verified
Correct Answer:
Verified
Q85: Two goods in an individual's consumption bundle
Q86: Scenario: e-Books and Sports Tickets Phillip has
Q87: Figure: The Consumption of Video Games and
Q88: Figure: Income and Substitution Effects <img src="https://d2lvgg3v3hfg70.cloudfront.net/TB1063/.jpg"
Q89: According to the relative price rule, the
Q91: (Table: Bundles of X and Y) Look
Q92: Figure: Consumer Equilibrium IV <img src="https://d2lvgg3v3hfg70.cloudfront.net/TB1063/.jpg" alt="Figure:
Q93: Figure: Income and Substitution Effects<br>(Figure: Income and
Q94: Figure: Harold's Indifference Curves The figure shows
Q95: (Table: Utility from Oranges and Starfruit) Oranges