Essay
Figure: Strawberries and Submarines II
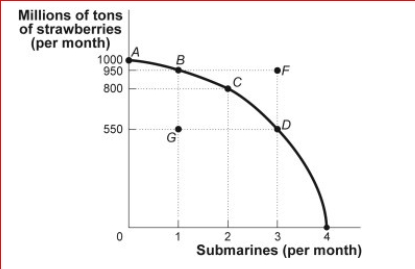
 (Figure: Strawberries and Submarines II) Look at the figure Strawberries and Submarines II.Assume that the economy is now operating at point
A.The opportunity cost of moving to point C is equal to million tons of strawberries:
A.800
B.200
C.2
D.50
Correct Answer:

Verified
Correct Answer:
Verified
Q9: The circular-flow diagram illustrates how households _
Q50: "Teachers in northern New Hampshire should earn
Q110: Use the following to answer questions :
Q222: The current rate of unemployment is 9%.This
Q225: Economists use models to explain real-life situations
Q227: Figure: Wine and Wheat<br>(Figure: Wine and Wheat)
Q228: Figure: Wine and Wheat<br>(Figure: Wine and Wheat)
Q231: Figure: Production Possibilities and Circular-Flow Diagram<br> <img
Q284: Use the following to answer questions: <img
Q313: Use the following to answer questions :