Essay
Figure: Production Possibilities and Circular-Flow Diagram
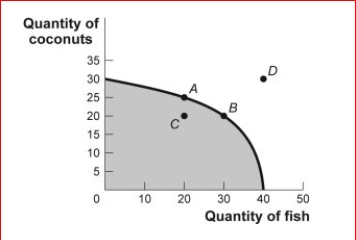
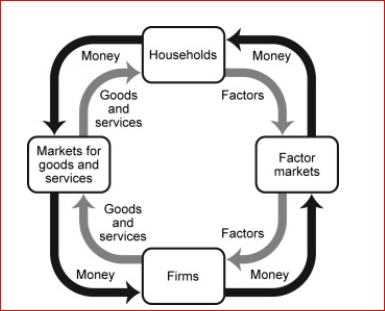
 (Figure: Production Possibilities and Circular-Flow Diagram) Look at the figure Production Possibilities and Circular-Flow Diagram.Assume the two figures represent the same economy.Suppose that in the circular-flow diagram a significant increase in productivity occurs inside most of the firms.This results in a significant increase in the output of both coconuts and fish.If all other variables remain unchanged, then the adjustment in this economy would be best represented in the production possibilities figure by a movement from point A toward:
A.point A (no movement would occur).
B.point B (an increase in fish production).
C.point C (a decrease in coconut production).
D.point D (an outward shift of the entire curve).
Correct Answer:

Verified
point D (a...View Answer
Unlock this answer now
Get Access to more Verified Answers free of charge
Correct Answer:
Verified
View Answer
Unlock this answer now
Get Access to more Verified Answers free of charge
Q4: In the simplest circular-flow model,households supply _
Q172: In one day, Kessy can bake 10
Q226: Figure: Strawberries and Submarines II<br> <img src="https://d2lvgg3v3hfg70.cloudfront.net/TB1063/.jpg"
Q227: Figure: Wine and Wheat<br>(Figure: Wine and Wheat)
Q228: Figure: Wine and Wheat<br>(Figure: Wine and Wheat)
Q232: Which are the two markets represented in
Q234: One of the controversies surrounding America's energy
Q235: Scenario: Linear Production Possibility Frontier<br>Largetown has a
Q284: Use the following to answer questions: <img
Q313: Use the following to answer questions :