Multiple Choice
Consider the following graph. 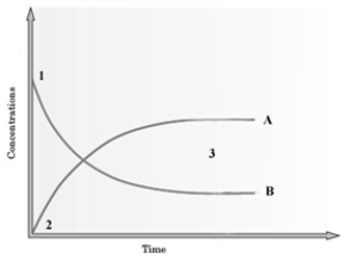 The graph is based on data collected from the following reaction.
  Which curve on the graph represents the change in concentration of CH3COOC2H5 for the forward reaction?
A) A
B) B
C) It is not possible to show the production of water.
Correct Answer:

Verified
Correct Answer:
Verified
Q24: When considering the effect of a catalyst
Q25: Solid sodium chloride and solid silver nitrate
Q26: In writing the equilibrium constant expression, we
Q27: The reaction H<sub>2</sub>O<sub>2</sub>(l) + 3I<sup>-</sup>(aq) + 2
Q28: Which of the following is not true
Q30: The term "heterogeneous catalyst" means which of
Q31: How does the rate of reaction change
Q32: For the reaction <img src="https://d2lvgg3v3hfg70.cloudfront.net/TB8310/.jpg" alt="For the
Q33: Suppose the equilibrium constant for the chemical
Q34: If the exothermic reaction <img src="https://d2lvgg3v3hfg70.cloudfront.net/TB8310/.jpg" alt="If