Multiple Choice
TABLE 2-6
A sample of 200 students at a Big-Ten university was taken after the midterm to ask them whether they went bar hopping the weekend before the midterm or spent the weekend studying, and whether they did well or poorly on the midterm. The following table contains the result.
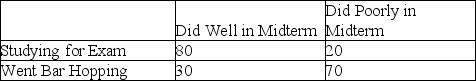
-Referring to Table 2-6, if the sample is a good representation of the population, we can expect ________ percent of those who did poorly on the midterm to have spent the weekend studying.
A) 10
B) 22.22
C) 45
D) 50
Correct Answer:

Verified
Correct Answer:
Verified
Q22: TABLE 2-11<br>The ordered array below resulted from
Q24: TABLE 2-14<br>The table below contains the number
Q28: Given below is the scatter plot of
Q30: TABLE 2-14<br>The table below contains the number
Q31: TABLE 2-5<br>The following are the duration in
Q32: TABLE 2-5<br>The following are the duration in
Q90: In constructing a polygon,each class grouping is
Q128: When constructing a frequency distribution,classes should be
Q141: Data on 1,500 students' height were collected
Q168: When comparing two or more large sets