Short Answer
TABLE 14-15
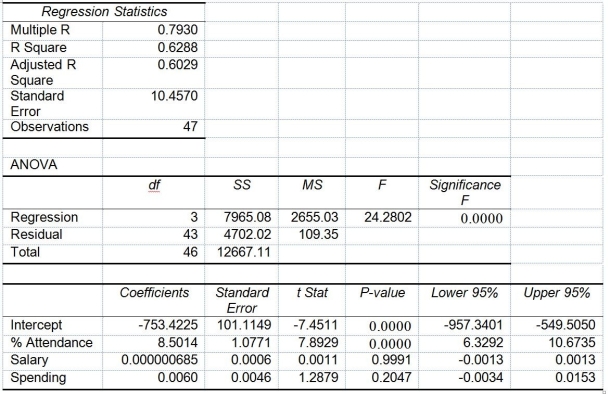
The superintendent of a school district wanted to predict the percentage of students passing a sixth-grade proficiency test. She obtained the data on percentage of students passing the proficiency test (% Passing), daily mean of the percentage of students attending class (% Attendance), mean teacher salary in dollars (Salaries), and instructional spending per pupil in dollars (Spending) of 47 schools in the state.
Following is the multiple regression output with Y = % Passing as the dependent variable, X₁ = % Attendance, X₂= Salaries and X₃= Spending:

-Referring to Table 14-15, what is the p-value of the test statistic when testing whether daily average of the percentage of students attending class has any effect on percentage of students passing the proficiency test, taking into account the effect of all the other independent variables?
Correct Answer:

Verified
6.73E-10 o...View Answer
Unlock this answer now
Get Access to more Verified Answers free of charge
Correct Answer:
Verified
View Answer
Unlock this answer now
Get Access to more Verified Answers free of charge
Q214: Multiple regression is the process of using
Q230: TABLE 14-3<br>An economist is interested to see
Q231: TABLE 14-3<br>An economist is interested to see
Q232: TABLE 14-13<br>An econometrician is interested in evaluating
Q233: TABLE 14-18<br>A logistic regression model was estimated
Q234: TABLE 14-9<br>You decide to predict gasoline prices
Q236: TABLE 14-17<br> <img src="https://d2lvgg3v3hfg70.cloudfront.net/TB1602/.jpg" alt="TABLE 14-17
Q237: TABLE 14-11<br>A weight-loss clinic wants to use
Q239: TABLE 14-16<br>What are the factors that determine
Q240: TABLE 14-8<br>A financial analyst wanted to examine